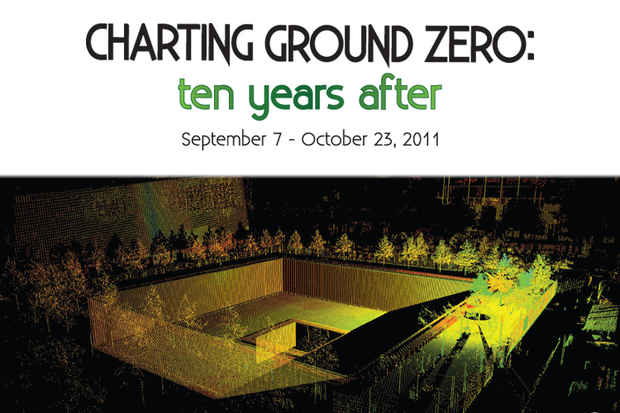
"Charting Ground Zero: ten years after" Exhibition
Woodward Gallery

This event has ended.
The City of New York and the Center for the Advanced Research of Spatial Information (CARSI) of Hunter College-CUNY, in collaboration with Woodward Gallery, proudly presents “Charting Ground Zero Ten Years After.” This exhibition provides an extensive aerial and ground overview of the World Trade Center site before, just after September 11th and the sites evolution over the last decade. It uses the latest scientific advances in mapping technology and cartographic representation, to show the transformation of the site. The mapping and spatial analysis technologies played a crucial role in helping the city assess damage, monitor the progress of recovery, and safely deploy personnel and equipment in the disaster zone. Those same technologies are used to show how the site has evolved over the last decade.
Remote-sensing technology used to create the maps included aerial photography, laser-based instruments called LIDAR (light detection and ranging), and thermal sensors. Mounted on planes, LIDAR penetrated the heavy smoke rising from the devastated area and captured the first clear images of the scene. Thermal imaging was used to determine where fires were still smoldering and, over time, the movement of these “hot spots” throughout the area. New LIDAR images taken in 2010 will reveal extremely fine detail of the 9/11 development site.
As part of a broader effort involving the City’s Office of Emergency Management’s Mapping and Data Center and Hunter College’s CARSI lab, directed by Professor Sean Ahearn, a team of Geo-spatial scientists analyzed the data, then created the many maps used by the city to monitor the changes at Ground Zero and to speed in recovery. The “before” images of the World Trade Center site, which will be included in the exhibition, were generated from the NYCMap (pronounced “nice map”), a database of highly detailed geographic information on the entire city, accurate to within 18 inches. Created over a period of five years, the map was a joint project of DoITT, the Department of Environmental Protection, and Hunter’s CARSI lab. The later images were produced with very high resolution LIDAR taken in the spring of 2010 by Sanborn Map Company with funding from NYC DCAS. Ground-based LIDAR images were collected on August 24, 2011 by the Computer Vision Laboratory of Hunter College - CUNY, Director Professor Ioannis Stamos.
Media
Schedule
from September 07, 2011 to October 23, 2011
Opening Reception on 2011-09-07 from 18:00 to 20:00